Tuesday, December 30, 2014


more and more government intervention means less and less freedom and economic progress.....

but the 'progressives' (ie: socialists et al) believe just the opposite, yet they do not look at the reality of their 'thinking'.....and the actual real-life results of their so called progressive agenda: less freedom and liberty!


What's the Best Country for Business?

December 30, 2014
Forbes recently released its list of the best countries for business, and the United States has found itself far down the list. Kurt Badenhausen reports that America fell four spots this year, dropping to 18th place. While the country was second on the list in 2009, it has declined every year since.
Why the decline? Badenhausen offers a number of reasons:
  • The U.S. government has expanded in size, bringing with it a host of new regulations in the health care and finance industries.
  • Since 2009, there have been 130 new major federal regulations for starting businesses, costing $60 billion annually.
  • For seven years in a row, the United States has dropped in the "economic freedom" rankings, as compiled by the Heritage Foundation, and its "monetary freedom" ranking is eighty-first out of 146 countries.
  • America's corporate tax rates are the highest in the developed world, and the tax system is incredibly complex. The World Bank ranks the U.S. corporate tax system forty-third among 146 nations.
Which nation topped the Forbes list? Denmark. Badenhausen explains that its few regulations make it easy -- and relatively inexpensive -- to start new businesses in the country. Following Denmark and rounding out the top 10 were Hong Kong, New Zealand, Ireland, Sweden, Canada, Norway, Singapore, Switzerland and Finland.
Source: Kurt Badenhausen, "U.S. Slides Again As Denmark Tops Forbes' Best Countries For Business," Forbes.com, December 17, 2014.

Tuesday, November 18, 2014

proliferation of laws, rules, and regulations...

Liberty and freedom require effort, sacrifice, honor and a people with a strong moral character.

“Only a virtuous people are capable of freedom. As nations become more corrupt and vicious, they have more need of masters.”-Benjamin Franklin
Historian Tacitus noted, as Rome became more and more corrupt, the number of laws grew rapidly. The Roman aristocracy, through corruption and thievery achieved lofty status in Roman society. Senators and wealthy knights engaged in extensive practices of conspicuous consumption, creating palatial town houses and monumental “art villas” to demonstrate their high rank in society. The peasants sank into poverty, while being satiated with bread and circuses. And it was all done legally, just as it is being done legally today by our beloved aristocracy and their minions.
“The more corrupt the state, the more numerous the laws.” – Tacitus – The Annals of Imperial Rome
Has the proliferation of laws, rules, and regulations over the last century made us freer, safer and less corrupt?

(this is truly an amazing graphic.....)

We live in a warfare/welfare surveillance state built on a foundation of debt, consumerism, and delusion, with no tears. We’ve learned to love our servitude.


Thursday, October 30, 2014

Yesterday's FOMC Statement
The FOMC voted to leave the Fed's target interest rate unchanged at 0.00% to 0.25% for the 49th consecutive meeting yesterday. 
They did, in fact, announce the end of the third round of quantitative easing although they will continue to reinvest the cash-flows from the S.O.M.A. 
All told, the Fed has now increased its balance sheet through three rounds of quantitative easing by $3.7 trillion, from 6.2% of GDP to 25.7% (see chart).
(The Market Today ONLINE)

A very interesting data set....

Tuesday, October 21, 2014

starts and permits - September 2014


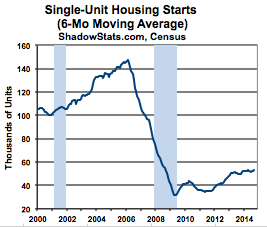
Some interesting data sets regarding housing...can anyone say 'continued volatility' with multifamily taking the lead...


U.S. housing starts increased 6.3% in September, driven primarily by multifamily construction.


Wednesday, September 10, 2014


Federal Reserve Chair Janet Yellen has long said she remains focused on the health of the labor market, and in her most recent public comments at Jackson Hole, she said that given the current state of the labor market, there was "no simple recipe for appropriate policy in this context." 

And for Gundlach, one chart makes clear why Yellen's desire to raise interest rates is most likely far less than many assume. 

Wages as a percent of GDP remain near multi-decade lows, and until this trend shows any sign of improvement, Gundlach doesn't think that Yellen will want to do anything with interest rates. 

Gundlach also noted that real wages for the bottom seven deciles of earners had fallen between 2007 and 2014, to which Gundlach said, "It seems tough that with so many workers losing purchasing power on a year-over-year basis, you could raise short-term interest rates." 


Wednesday, August 27, 2014


This graph appears to provide a vivid indicator that the world's economic condition is not moving in a 'positive' direction....yields headed downward is not indicative of strong economic growth trends! 
How much 'spoken word' power from the European central banks has assisted with this downward movement with everyone speaking about potential QE?
Although it is very interesting that the 'risk premium' for Italy and Spain appears to have dissipated...in spite of their continuing economic struggles.


Chart Of The Day

Tuesday, August 26, 2014

The Schizophrenic US Housing Market In One Chart

by Tyler Durden on 08/21/2014 

For those who are looking for just one chart with which to summarize the US housing market, here it is courtesy of the NAR, which earlier today reported July existing home sales, which despite beating expectations, were still 4.3% below the 5.38 million annualized homes sold a year ago.
The chart shows that while the housing market for the low-end continues to collapse (the 12.9% drop was "only" -12% three months ago), and the mid-range is virtually frozen, all the upside activity, activity which pushes the median price ever higher (in July it was $222,900, 4.9% percent above July 2013 and the 29th consecutive month of year-over-year price gains), was in the ultra-luxury segment, or houses which cost over $1 million as the "1%", both foreign and domestic, continues to convert their pieces of fiat paper into hard real-estate assets
Source: NAR

Monday, August 25, 2014

household income and the velocity of money

Two interesting data sets that provide some insight into the struggles that we are facing in the real life economics of the new normal...


Real median household income has declined, meaning the purchasing power of earnings fell.


An economy in good health has a high velocity of money. 
 

Tuesday, August 19, 2014

Housing Permits, Starts Surge Driven By Renewed Rental Housing Scramble

Starts:


And Permits:

So is this the housing recovery everyone's been waiting for? Sadly, no, because one glance at the internals reveals that virtually all of the surge higher was on the back of multi-family housing units. Specifically, in permits, virtually all of the rise was due to multi-family, aka rental, unit construction, which soared by 73K, from 309K to 382K, a 24% increase, while single family, residential, units were up by a tiny 6K, or less than 1%.

Start was more of the same, because while single-family units here did post a modest improvement, rising to 656K, it well below the 710K highs reached in November 2013, all of the action was again in multi-family units, which exploded higher by a whopping 33% in one month, from 318K to 423K. This just happens to be the highest print since Lehman and matches the other highest mult-fam housing record in the past decade from January 2006, when the same number of multi-family housing units was started.
Finally, considering just how volatile this series has become, don't be surprised if in September the July data is revised wildly lower considering the wild margin of error, especially on the Starts side, where the "final" data point is within 11% of the presented number.
by Tyler Durden on 08/19/2014 

Friday, August 15, 2014

Fed speak


Fed speak - latest edition:

Yellen said the central bank has no “mechanical answer” for when to raise rates, and that before doing so, policy makers must be certain the economy is on a solid footing. While her overall view is positive, she said there are still “mixed signals” and “we have in the past seen sort of false dawns.” 

St. Louis Fed President James Bullard said July 17 the Fed may have to raise rates more quickly than planned and that it’s “closer to its macroeconomic targets today than it has been most of the time since 1960.” 


Ex-Fed speak - 

J. Alfred Broaddus, president of the Richmond Fed from 1993 to 2004, said while the risk of getting behind the curve on raising rates is increasing, “this is a different world” with economic data harder to interpret than ever before. “If I were there now I would be conflicted,” Broaddus said. “This is a difficult time and there’s a lot that’s unprecedented here.” 

Saturday, June 14, 2014

THE FED....

The Mixed Track Record of the Fed's First 100 Years


June 2014
While established as a lender of last resort, the Federal Reserve has morphed into a central bank with discretionary authority and a record of mixed results, according to Jerry L. Jordan, former President of the Federal Reserve Bank of Cleveland.
Jordan identifies a number of problems with the concept of central banking in general, including:
  • Moral hazard: Central banks with discretionary authority create moral hazards, because the safety net offered by a central bank leads private financial institutions to act in ways that they would otherwise not act, because gains are privatized but losses are socialized.
  • Myth of independence: Far from being independent, central banks feel political pressures and will try to alter policies in order to respond to crises. When central banks attempt to correct other government mistakes, there is no exit strategy that does not create other damage.
  • Discipline: U.S. policymakers have not been disciplined by institutional arrangements intended to keep currency stable. In the 1960s, the U.S. began abusing its ability to borrow in its own currency, and the government ran larger and larger budget deficits.
  • Transparency: Because the central bank's future policy plans influence short-term behavior by the market, their deliberations must be conducted in secret. Debates over the Fed's response to events cannot be broadcast in front of the public.
Today, there are essentially no rules governing central bank lending, explains Jordan. The Fed has loaned money to insolvent institutions, and there is no clear guidance governing who will, or will not, be bailed out in the future. Under the Fed, the U.S. has seen the Great Depression, 1970s-era inflation and a number of bubbles, panics and crises. We need effective arrangements, Jordan writes, in order to prevent more of the same from happening in the future.
Source: Jerry L. Jordan, "A Century of Central Banking: What Have We Learned?" Cato Journal, Vol. 34, No. 2 (Spring/Summer 2014). 

Tuesday, May 6, 2014

the regulatory state


Economic speed bumps and road blocks and hurdles, oh my......

The Regulatory State
May 5, 2014
It cost Americans a whopping $1.863 trillion to comply with federal regulations in 2013, more than the gross domestic product (GDP) of Canada, according to a new report from Clyde Wayne Crews, vice president for policy at the Competitive Enterprise Institute.
Federal spending and deficits dominate the debate in Washington, but the costs of federal regulations reach hundreds of billions of dollars each year. And just as corporate taxes are passed on to consumers, so are regulatory compliance costs passed on to consumers and workers in the form of higher prices and lower wages.
The Competitive Enterprise Institute's annual report on the state of federal regulations highlights the significant impact of the regulatory state on the U.S. economy:
  • The ratio of new regulations (issued by agencies) to new laws (passed by Congress) was at 51 in 2013. That is 51 new rules for every new law, equivalent to a new rule every 2.5 hours.
  • Regulatory costs equate to $14,974 per household -- 23 percent of the average household income.
  • The Federal Register last year had 79,311 pages, the fourth highest in history. The years with the highest number of pages in the Federal Register were 2010 and 2011, both under President Obama.
  • The Departments of the Treasury, Commerce, Interior, Health and Human Services, Transportation, and the Environmental Protection Agency are responsible for 49.3 percent of all federal rules.
  • Small businesses pay a disproportionate amount in regulatory costs compared to large firms. Businesses with less than 20 employees pay an average $10,585 in regulatory costs per employee, compared to $7,755 for businesses with 500 or more employees.
  • U.S. regulatory costs exceed the GDPs of both Canada and Australia.
If U.S. federal regulation were a country, it would be the 10th largest economy in the world, ranked between India and Italy.
Source: Clyde Wayne Crews, "Ten Thousand Commandments 2014," Competitive Enterprise Institute, April 29, 2014.

Wednesday, April 23, 2014

Is the leverage rubber band reaching its breaking point once again? Interesting data to ponder upon.....


Is This What a Credit Bubble Looks Like?


Saturday, February 15, 2014

The paradox of virtual money

The paradox of virtual money -

Virtual money creation: fabricated money generates a surreal synthetic economy based upon over leveraging of virtual assets resulting in extreme and contagious adjustments...


Fed's balance sheet -


The Global Economic Crisis Is Starting To Catch Fire


The next two years (2014 and 2015) are going to represent a major "turning point" for the global economy.  By the end of 2015, things are going to look far different than they do today.
None of the problems that caused the last financial crisis have been fixed.  Global debt levels have grown by 30 percent since the last financial crisis, and the too big to fail banks in the United States are 37 percent larger than they were back then and their behavior has become even more reckless than before.
As a result, we are going to get to go through another "2008-style crisis", but I believe that this next wave is going to be even worse than the previous one.
So hold on tight and get ready.  We are going to be in for quite a bumpy ride.

BIS veteran says global credit excess worse than pre-Lehman

Extreme forms of credit excess across the world have reached or surpassed levels seen shortly before the Lehman crisis five years ago, the Bank for International Settlements has warned.


The share of “leveraged loans” used by the weakest borrowers in the syndicated loan market has jumped to an all-time high of 45pc, ten percentage points higher than the pre-crisis peak in 2007-2008.

The Swiss-based `bank of central banks’ said a hunt for yield was luring investors en masse into high-risk instruments, “a phenomenon reminiscent of exuberance prior to the global financial crisis”.
This is happening just as the US Federal Reserve prepares to wind down stimulus and starts to drain dollar liquidity from global markets, an inflexion point that is fraught with danger and could go badly wrong.
“This looks like to me like 2007 all over again, but even worse,” said William White, the BIS’s former chief economist, famous for flagging the wild behaviour in the debt markets before the global storm hit in 2008.
“All the previous imbalances are still there. Total public and private debt levels are 30pc higher as a share of GDP in the advanced economies than they were then, and we have added a whole new problem with bubbles in emerging markets that are ending in a boom-bust cycle,” said Mr White, now chairman of the OECD’s Economic Development and Review Committee.
The BIS said in its quarterly review that the issuance of subordinated debt -- which leaves lenders exposed to bigger losses if things go wrong -- has jumped more than threefold over the last year to $52bn in Europe, and jumped tenfold to $22bn in the US.

Sunday, January 26, 2014

China's Great Wall of Credit Begins to Crumble

leverage, leverage and more leverage.....it is the magic economic growth enhancer...but it acts just like a rubber band.....when it is stretched too far - it always breaks!

On another note - have not heard/seen much about the other 'fast growing' country (India) lately.......is no news good news???


China's Great Wall of Credit Begins to Crumble


China’s credit-fueled bubble economy is falling to pieces before our very eyes.
Between 2008 and 2013, China’s credit market increased from $9 trillion to an incredible $23 trillion.
To give this number some perspective, China’s GDP is a little over $7 trillion. So China today has a credit market well north of 300% of its GDP.
There is simply no other way to view this than as a bubble. Indeed, we see all of the clear signs of a bubble in the real estate markets today with countless ghost cities, massive empty malls, and other excess capacity.
What’s truly stunning to witness however, is the fact that in spite of all of this expansion in credit, China’s GDP growth continues to fall.
Indeed, GDP is now trending downwards for the first time in a decade. China’s Government has realized that this is a major problem for the country and so has announced that “GDP is no longer a measure of success.”
This is an incredible admission from the Chinese Government as everyone on the planet knows China’s GDP measure has been a work of fiction for decades. The fact that GDP growth is slowing in spite of all the manipulation of the metric is a major sign that things are sharply turning for the worse in the People’s Republic.
Indeed, we get additional indications that China’s economic data is dramatically overstated from other less massaged metrics.
China recently announced that it would be implementing a crackdown on fraudulent trade invoicing. It is not coincidence that right after this, China posted a truly horrible steel export results for the month of May: a mere 1% increase from the year before (hardly the stuff of which 8% GDP growth is made of).
Another metric is electricity usage, which increased by a mere 2.9% in the first quarter of 2013.
So, steel exports are increasing by 1% year over year. Electrical usage increased by just 2.9% in the first quarter of this year, and the Chinese Government has announced that the world should stop looking at its GDP numbers because they are not truly indicative of the economy there.
The Government is right in saying this, though not in the way it means. China’s GDP is not indicative of its true GDP growth… it’s sharply overstating it.
More evidence shows up in the China ETF (FXI) which has been in a massive wedge pattern for five yeas now. AS soon as we take out that bottom line, it’s GAME OVER.


Investors take note, China, the growth engine for the global economy is sputtering. The implications will be serious for markets globally.

Monday, January 20, 2014

Mega Default In China


leverage, leverage and more leverage - and then leverage on top of leverage.....it is always the systemic problem that brings an economy to a halt (ruin)....

leaders try to tinker and put band aides on the problems (or ignore them and just throw more money at them) and they grow until one day the leverage rubber band breaks....

this article could have be written about most industrialized nations and their history of dealing with economic issues - including America!

Mega Default In China Scheduled For January 31

http://www.forbes.com/sites/gordonchang/2014/01/19/mega-default-in-china-scheduled-for-january-31/

In short, China’s growth since the end of 2008 has been dependent on ultra-loose credit first channeled through state banks, like ICBC and Construction Bank, and then through the WMPs, which permitted the state banks to avoid credit risk.  Any disruption in the flow of cash from investors to dodgy borrowers through WMPs would rock China with sky-high interest rates or a precipitous plunge in credit, probably both.  The result?  The best outcome would be decades of misery, what we saw in Japan after its bubble burst in the early 1990s.

Most analysts don’t worry about a WMP default.  Their argument is that the People’s Bank of China, the central bank, is encouraging a failure of the Zhenfu product to teach investors to appreciate risk and such lesson will improve the allocation of credit nationwide.  Furthermore, they reason the central authorities would never allow a default to threaten the system. 

Observers make the logical argument that “to have a market meltdown, you have to have a market” and China does not have one.  Instead, Beijing technocrats dictate outcomes.

That’s correct, but that is also why China is now heading to catastrophic failure.  Because Chinese leaders have the power to prevent corrections, they do so.  Because they do so, the underlying imbalances become larger.  Because the underlying imbalances become larger, the inevitable corrections are severe.  Downturns, which Beijing hates, are essential, allowing adjustments to be made while they are still relatively minor.  The last year-on-year contraction in China’s gross domestic product, according to the official National Bureau of Statistics, occurred in 1976, the year Mao Zedong died.

Why will China’s next correction be historic in its severity?  Because Chinese leaders will prevent adjustments until they no longer have the ability to do so.  When they no longer have that ability, their system will simply fail.  Then, there will be nothing they can do to prevent the freefall. 

Tuesday, January 14, 2014

And The Most Unexpected Correlation To The Fed's Balance Sheet Is...

Here it is.....and who says we don't live in a 'form over substance' world!

And The Most Unexpected Correlation To The Fed's Balance Sheet Is...


While the Fed pays lip-service to its increased transparency, the volumes of caveats and wordsmithing we exposed last week continue to surge.The problem is becoming worse for the Fed and is showing up in the oddest correlation to the Fed Balance Sheet we have found yet. As Deutsche Bank's Thorsten Slok shows, as the 'unemployment rate' approaches the 6.5% 'threshold', FOMC statements have surged in their verbiosity. Simply put, as Slok quantifies, it is becoming more and more difficult for the Fed to explain (away) what it is doing (and more and more expensive). And another thing we can look forward to: when the Fed's balance sheet hits $1 quadrillion in a few short years, at the current pace of expansion the FOMC statement will be 25,000 words, or the equivalent of a 100 page book.

Saturday, January 11, 2014


The growth in temporary jobs along with the lack of income growth have had a dramatic impact (not positive!) on our country's economic recovery efforts. 
The foundation must be firmed before we can move forward and our fearful leaders in Washington DC only want to play games with semantics...and pass the blame (while keeping their cushy power jobs and benefit package)!


More Than Half Of December Jobs Added Were Temporary


Once again, in its sheer panic to tout the quantity, or lack thereof, in the case of the December jobs number, the frenzied media and pundits completely ignored the quality of the jobs gained in the last month of December. Or lack thereof. Because as the simple breakdown below shows, of the 74K jobs gained in December, 55%, or 40K were the worst of the lot when it comes to wages or benefits: temporary jobs.

As for the other job additions? Well, between Temp Help, and the bottom of the barrel paying Retail and Wholesale Trade jobs, the total additions were 111K. Which means all the other, better-paying, job groups saw... a drop of 35K.


It's Official: The US Created Less Jobs In 2013 Than 2012


The Fed spent over $1 trillion in 2013 (to push the stock market to all time highs) and all we got was... less jobs created than in 2012?
Establishment survey 2012 vs 2013 job change:
And Household survey 2012 vs 2013 job change:
Source: BLS

Chart Of The Day


Wednesday, January 8, 2014

data points for ponderment


Retail Sales Point to Continuing Struggle for Economy

ICSC-GS-RetailSales-010714-2

As you can see the trend in the data is clearly weakening and is unlikely to change much in coming months as higher healthcare costs, and taxes, weighs on consumer's disposable incomes.


This Chart Is A True Representation Of The Employment Crisis In This Country


The civilian labor force in the US has been causing bouts of hand-wringing and head-scratching. It represents the official number of people working or looking for work. It’s what the official unemployment rate (U-3) is based on. If labor force participation drops – if for whatever reason, millions of people are no longer counted as part of the labor force, as is the case in the US – it’s a troublesome indicator for the economy and the realemployment picture.
It also makes the unemployment rate, now 7.3%, look a lot less awful: if you’re not counted in the labor force, and you don’t have a job, you’re not counted as unemployed. There are millions of people in that category. And their numbers are growing, not diminishing.
This chart is a true representation of the crisis of employment in this country,” Dillon wrote. The diminishing labor force participation rate – the officially available labor pool, however unrealistic it might be – has been driving down the unemployment rate for the first time in history.

Thursday, January 2, 2014

Some fun facts to start 2014 -

Bonds experienced their first losing year since 1999 according to BAML research.

Stocks rose almost 30% and the Fed's balance sheet grew almost $1.1 trillion.

Stock prices rose 29% for the year.

The federal deficit shrank but total U.S. debt rose to over $18 trillion.

2014 is starting off with market prices at very different places than where they began 2013.

The 30-year fixed mortgage rate has risen from 3.35% to 4.48%.  (113 basis point increase)

The 10-year Treasury yield is up from 1.76% to 3.02%. (126 basis point increase)

The 5-year Treasury yield is up from 0.74% to 1.74%.

The 2-year yield is up from 0.26% to 0.38%.

The Census Bureau projected yesterday that the U.S. population will have grown to 317,287,938 as of January 1. That reflects a 0.7% YoY growth rate in 2013, the slowest rate of growth since the Great Depression according to research from the Brookings Institute.