Wednesday, October 31, 2012

Frightful news on this Halloween....

Scary Cliff:The National Association of Manufacturers has released a report showing thatif all the scheduled spending cuts and tax increases took effect when the Fiscal Cliff hits, it would cost 6mm jobs and push unemployment to 11% by 2014.
 
Muni Retirement Risk:A Pew study finds the gap between state assets and obligations nationwide is now $1.4T, up about 9% from the prior year.
 
Euro Stress:The latest data shows unemployment in the Euro Zone hit another record in Sept., reaching 11.6%. This compares to 7.8% in the U.S. and 7.9% in the U.K. Overall, Spain was in the worst shape at 25.8%, followed by Greece at 25.1%. The data shows problems in the EU are far from resolved and more is needed to get things moving again. This is particularly important to the U.S. because the EU accounts for about 21% of overall U.S. exports.
 
Debt Owed: The latest data from the Treasury shows every household in the U.S. owes about $47,495 to foreign countries, a 72% increase since 2008 (the largest amount, about $10,000, is owed to China).
 
(source: PCBB Newsletter)

Friday, October 26, 2012


GDP Grows 2.0% in 3Q

GDP grew 2.0% in the third quarter, beating expectations of 1.8%. This is slightly better than the 1.3% growth rate seen in Q2.

Looking at the various components of GDP -

- Personal consumption grew at a 2.0% rate, up from 1.5% in Q2.

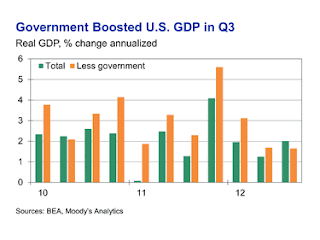
- Government spending grew 3.7%, following eight consecutive quarters of contraction.

- Business investment, what has been a strong area of growth during the recovery, dropped 1.3%.

- However, housing was up 14% for the quarter. Unfortunately, housing is such a small part of the economy now that even a 14% rate of growth did not make a meaningful impact to the total numbers.

All in all, this GDP report illustrates moderate growth in the economy once again. The consumer continues to muddle along, business spending has slowed, and housing is recovering. There is no new news in that.

The Market Today ONLINE


The real U.S.GDP growth rate was lifted by government for the first time since 2010.

Monday, October 22, 2012

CPI YOY

Looks like we are headed back into the 2.00% + range – is this a blip (comparable to the first part of this year) or will we see more pricing pressure (movement in commodity prices working their way through the system) begin to move the meter upward and create additional stress for the Fed!
 
Interesting note for this data set: the high was on 10/31/06 and the low was on 10/31/10!
CPI Year-Over-Year


Friday, October 19, 2012

trend lines

Looks like volatility to me!
Should we begin calling this trend the “Tigger” bounce?
And with everything that we have coming up as we head toward the end of this year, I would ponder to say we shall see more of this bouncing…
Continued domestic economic stress, election season unknowns, fiscal cliff coming, European stress continues, China’s continued economic slow down…a lot of stuff happening to continue volatility’s active presence.


Thursday, October 18, 2012

perspective on housing starts

The beginning of some positive signs of improvement in the housing sector are very welcome after such a long period of entrenchment. But when we look at the numbers from the perspective of past performance one can see that we have a way to go to get out of the valley. The ‘amazing-ness’ of this graph’s depiction of the precipitous drop in housing starts is truly mind numbing. The question to ask is - how do we return to the consistent growth trend line levels of earlier times? While understanding that the steep growth trend that took place from 2002 – 2006 was not built upon a viable financial model.
 
• September Housing Starts Surge Was Marginally Significant
But Not Credible
Shadow Government Statistics, American Business Analytics & Research LLC

Wednesday, October 17, 2012

housing update

Some positive news on the housing front. Interesting component is the continued strong trend in multi-family growth.
 
We received two strong housing reports this morning. Housing starts jumped 15% in September to an annualized rate of 872k, the best pace of growth since July 2008.
Single family starts grew 11% while multi-family starts jumped 25%. Building permits, a future indicator for starts, also rose by double digits, increasing 11.6%.
 
The Market Today ONLINE


Tuesday, October 9, 2012

mbs spread

QE3 working its magic….quite a drop!
Where will we end…nobody knows!
But it appears that the refi window will remain open for business….
 
One interesting thing to note is the continued drop in MBS security yields. The spread between a 30-year mortgage and the 7-year Treasury has dropped almost 100 basis points in the past two months. This is dropping mortgages rates. The 30-year mortgage rate, as quoted by Freddie Mac, is back to the record-low rate of 3.49%. Fifteen-year mortgage rates are now at 2.69%. This drop will likely spur on more refinance activity which we are already seeing in the MBA refi index.
 
The Market Today ONLINE


Saturday, October 6, 2012

job data detail


Probably more than you wanted to know but here is the detail on the two different data sets and how their survey information is derived.

For September, the politically important unemployment rate fell to 7.8% in September from 8.1% the prior month, according to the Labor Department. That was the lowest level since January 2009 and well below the 8.1% forecast of economists surveyed by Dow Jones Newswires. The unemployment rate estimate is derived from a survey of households, which came up with an estimate that 863,000 jobs were added for the month.

But the separate establishment survey from which the official payrolls number is derived reported a more modest seasonally adjusted gain of 114,000 jobs in September. That was below the consensus forecast of 118,000, though the previous two months were revised higher.

Mr. Hall said the inconsistent reports reflect the different samples used in the two surveys, one focused on households the other on businesses. The establishment survey has a huge sample size of 141,000 business and agencies covering 486,000 worksites, whereas the household survey covers just 60,000 homes.

“The household survey is much smaller. When you look at something like labor force and employment levels, the uncertainty of those numbers is much larger,” said Mr. Hall. “Within two months, the household survey could show the unemployment rate eking back up.”

Thursday, October 4, 2012

currency debasements

A very interesting analysis of the end run effects of inflationary policy (ie: over abundant money creation) and the road that follows for an infected economy.
 
“History is replete with Great Disorders in which social cohesion has been undermined by currency debasements. The multi-decade credit inflation can now be seen to have had similarly corrosive effects. Yet central banks continue down the same route. The writing is on the wall. Further debasement of money will cause further debasement of society. I fear a great disorder,” Grice wrote in a note outlining why he is so worried about central bank policy and its cheerleaders.
Likening the printing of money to a stealth tax that erodes people’s spending power without anyone being able to place the blame for their loss of purchasing power, Grice said people need to blame someone.
“No one knows upon whom the burden falls. People notice only that they can’t afford the things they used to be able to afford, or they can’t afford the things which everyone else can afford.”
“They know that something is wrong, but they just don’t know what, why, or who is to blame. So inevitably they look for someone to blame”
Grice believes that the cost of currency debasement falls on those who do not benefit from the debasement when it occurs and believes people are finally waking up to this fact.
“Central banks provided cheap money to banks, the cheap money artificially inflated asset prices, artificially inflated asset prices made anyone connected to those assets rich as we became anation of speculators, those riches were achieved at everyone else’s expense, and everyone else has now realized what has happened and is understandable enraged,” said Grice who believes we are now locked in a blame game.
“The 99 percent blame the 1 percent, the 1 percent blame the 47 percent, the private sector blames the public sector, the public sector returns the sentiment, the young blame the old, everyone blame the richyet few question the ideas behind government or central banks.”
“I’d feel a whole lot better if central banks stopped playing games with money. But I can’t see that happening anytime soon. The ECB has thrown the towel in, following the [Swiss National Bank] last year in committing effectively to print unlimited amounts of money for the greater good. The [Bank of England] and the Fed have long since made a virtue of what was once considered a necessity, with what was once the unconventional conventional.”
 
As Iran’s Currency Plunges, Investors Warned on Debasement

Tuesday, October 2, 2012

September 2012 Manufacturing ISM Report


More mixed signals from the manufacturing sector. Prices were up again – indicative of underlying growing inflationary pressure buildup???


PMI at 51.5%

- New Orders, Employment and Inventories Growing
- Production Contracting
- Supplier Deliveries Slower

(Tempe, Arizona) — Economic activity in the manufacturing sector expanded in September following three consecutive months of slight contraction, and the overall economy grew for the 40th consecutive month, say the nation's supply executives in the latest Manufacturing ISM Report On Business®.

The report was issued today by Bradley J. Holcomb, CPSM, CPSD, chair of the Institute for Supply Management™ Manufacturing Business Survey Committee. "The PMI™ registered 51.5 percent, an increase of 1.9 percentage points from August's reading of 49.6 percent, indicating a return to expansion after contracting for three consecutive months. The New Orders Index registered 52.3 percent, an increase of 5.2 percentage points from August, indicating growth in new orders after three consecutive months of contraction. The Production Index registered 49.5 percent, an increase of 2.3 percentage points and indicating contraction in production for the second time since May 2009. The Employment Index increased by 3.1 percentage points, registering 54.7 percent. The Prices Index increased 4 percentage points from its August reading to 58 percent. Comments from the panel reflect a mix of optimism over new orders beginning to pick up, and continued concern over soft global business conditions and an unsettled political environment."

PERFORMANCE BY INDUSTRY

Of the 18 manufacturing industries,11 are reporting growth in September in the following order: Textile Mills; Food, Beverage & Tobacco Products; Printing & Related Support Activities; Wood Products; Apparel, Leather & Allied Products; Paper Products; Petroleum & Coal Products; Primary Metals; Fabricated Metal Products; Furniture & Related Products; and Miscellaneous Manufacturing.The six industries reporting contraction in September — listed in order — are: Nonmetallic Mineral Products; Electrical Equipment, Appliances & Components; Transportation Equipment; Machinery; Chemical Products; and Computer & Electronic Products.

WHAT RESPONDENTS ARE SAYING ...

§ "Appears that our so-called 'slowdown' was a summer thing. September brings with it increasing requirements and business." (Paper Products)

§ "Business improved through Q3, but is beginning to show signs of slowing down in Q4; this has been a typical trend over the last few years." (Wood Products)

§ "Business has picked up going into the last quarter." (Plastics & Rubber Products)

§ "We are sticking to our manufacturing plan, but have slowed production down considerably. Haven't added any new units to the 2012 plan, and still have no forecast for 2013 released." (Computer & Electronic Products)

§ "Sales have tanked over the last two months, bringing a very concerned and stressed management team. Not very optimistic for the near-term future." (Apparel, Leather & Allied Products)

§ "Uncertainty in the healthcare legislation (reform) continues to be the underlying force keeping our sales revenue below its full potential." (Miscellaneous Manufacturing)

§ "Steel and aluminum prices still dropping, and auto production orders are up." (Transportation Equipment)

§ "Domestic business is up; international is down." (Electrical Equipment, Appliances & Components)

§ "Demand seems to have stabilized from August. New orders are appearing this month without advanced notice from our customers." (Chemical Products)

MANUFACTURING AT A GLANCE
SEPTEMBER 2012


Index
Series
Index
Sep
Series
Index
Aug
Percentage
Point
Change


Direction
Rate
of
Change

Trend*
(Months)
PMI™
51.5
49.6
+1.9
Growing
From Contracting
1
New Orders
52.3
47.1
+5.2
Growing
From Contracting
1
Production
49.5
47.2
+2.3
Contracting
Slower
2
Employment
54.7
51.6
+3.1
Growing
Faster
36
Supplier Deliveries
50.3
49.3
+1.0
Slowing
From Faster
1
Inventories
50.5
53.0
-2.5
Growing
Slower
2
Customers' Inventories
49.5
49.0
+0.5
Too Low
Slower
10
Prices
58.0
54.0
+4.0
Increasing
Faster
2
Backlog of Orders
44.0
42.5
+1.5
Contracting
Slower
6
Exports
48.5
47.0
+1.5
Contracting
Slower
4
Imports
49.5
49.0
+0.5
Contracting
Slower
2
OVERALL ECONOMY
Growing
Faster
40
Manufacturing Sector
Growing
From Contracting
1

COMMODITIES REPORTED UP/DOWN IN PRICE and IN SHORT SUPPLY

Commodities Up in Price
Caustic Soda (2); Corn (3); Corn Products (2); Corrugated Boxes (2); Flour; Fuel (2); Gasoline; HDPE; Soy Bean Oil; Steel*; and Structural Steel.

Commodities Down in Price
Aluminum (2); Nickel (2); Stainless Steel (3); Steel* (7); and Steel Products.

Commodities in Short Supply
Plastic Components is the only commodity reported in short supply.